Dynamic Resources
Available from replication-manager 3.1.42. Every setting below is new in 3.1.42 unless another version is given.
Units: DBU for stateful, APU for stateless
replication-manager measures, plans and bills resources in units, not in raw cores and gigabytes. There are two kinds of unit, one per kind of workload:
| Unit | Workload | 1 unit = | IOPS |
|---|---|---|---|
| DBU, Database Unit | stateful: the database servers | 1 core, 4 GB memory, 20 GB disk | 1000 IOPS, locked in the unit |
| APU, Application Unit | stateless: proxies (ProxySQL, MaxScale, HAProxy) and applications | 1 core, 2 GB memory, 10 GB disk | none: a stateless service has no IO to reserve |
| BKU, Backup Unit | storage: the disk really used by the local backups of a database | 20 GB of disk, nothing else | none |
| BAU, Backup Archive Unit | remote storage: what is archived off the cluster on S3 or SFTP | 20 GB of disk, nothing else | none |
The three ratios are settings of the instance, resource-manager-ratio-dbu,
resource-manager-ratio-apu and resource-manager-ratio-bku (Settings → Marketplace), written
as cores=1,mem=4g,disk=20g,iops=1000; the table shows their defaults. Every graph, configurator
and bill reads the ratio from the instance, so changing a setting re-projects everything at
the next tick without resizing anything.
A unit is a bundle with a fixed ratio. A database that needs 2 cores, 8 GB and 80 GB is 2 DBU; one that needs 2 cores and 2 GB is still 2 DBU, because the unit follows the axis that binds (here CPU) and the others come with it. The ratios are the same everywhere.
Why two units: a database holds data, so memory (the buffer pool), disk and IOPS are what it lives on, and one core needs about 4 GB behind it to be useful. A proxy or an application holds no data: it needs cores and a little memory, disk only for its binary and logs, and no IOPS reservation at all. Sizing them with the same bundle would reserve 40 GB and 1000 IOPS a proxy never uses.
An application can be stateful too: a storage service such as minio holds data like a
database does. Such an app is accounted as DBU, not APU: its declared shape
(prov-app-cpu-cores, prov-app-memory, prov-app-disk-size) is projected with the
Database ratio and rounded up to whole DBU, reserved in the DBU pool of the infrastructure and
billed at the DBU price, with the same floor of one unit per running instance and the same
over/under-commit ratios. This is the app-stateful switch of the application (App →
Overview → Stateful); the shared minio template carries it as a default, so a minio created
from the template is stateful from the start. Stateful apps are their own DBU line, Stateful
units, next to the databases' plan, never added to it.
An application has no unit field of its own: what you declare is its shape per instance,
prov-app-cpu-cores, prov-app-memory and prov-app-disk-size, and the unit count is derived
from it at the ratio, times the running instances (one per agent for a flex app, one for a
failover app). The App Unit slider on the application page is a sizing helper: choosing N
units writes those three values at the ratio and asks for a reprovision, it stores nothing
else. The reservation history of every application and proxy is a graphite series next to
its consumption, apu.<cluster>.<name>.plan_apu, or plan_dbu for a stateful application.
- The plan is expressed in units:
prov-db-dbuper database,prov-proxy-apuper proxy or application. The cluster total,prov-service-plan-dbuandprov-service-plan-apu, is the sum over its members and is what you see as the plan line on the graphs. - What a service consumes is measured on its cgroup and converted to the same unit on each axis, so consumption, configuration and plan compare directly.
- Dynamic resources, below, move databases by whole DBU on the axis that binds.
A backup is not sized in DBU. Its local storage is counted in BKU: one unit is 20 GB of disk, the same quantity as the DBU disk axis, and nothing on the other axes. What is billed is the disk the local backups really use against a BKU plan of its own, set per database like the DBU plan. The default BKU plan is three times the database's DBU disk, so a database at N DBU starts with a plan of 3 × N BKU. Usage above the plan is over-commit: billed, never blocked. What leaves the cluster is a unit of its own, the BAU, described below.
Since 3.1.43 the BKU plan is the setting prov-db-bku (default 6, per cluster), moved from
the dashboard under Configurator → Database Configurator → Resources → Backup BKU. Two
measurements are taken every 30 monitoring ticks:
- BKU, local: the disk really used on the local pool by the cluster's backups: the last
backup of each server in its backup directory, plus the restic archive when its repository
is a local path. A backup kept after its push to the archive is on disk twice and counts
twice. This is what the BKU plan covers. The usage is rounded up to the next unit and priced
around the plan with the instance's two price ratios (below); the unit price is
cloud18-marketplace-bku-price(Eur per BKU per month, Settings → Marketplace, 0 = local backups not priced). Local usage above the plan raises WARN0219 on the cluster, an accounting signal only: nothing is stopped or purged because of it. - BAU, remote archive: what is archived off the cluster through restic, when its
repository is on S3 or SFTP, as the repository really holds it after deduplication. One BAU
is the same 20 GB. There is no plan for the archive: it is tracked and billed on usage,
rounded up to the next unit, at
cloud18-marketplace-bau-price(Eur per BAU per month, Settings → Marketplace, 0 = not priced). The price applies to Signal18 or partner storage only: a cluster that brought its own remote storage switches on Remote Archive On Client Storage (Settings → Cloud18,cloud18-marketplace-bau-client-storage) and its archive is measured but never priced.
The Graphs → Resources page shows the local backups as BKU bars against the plan line and the remote archive as BAU bars, next to the DBU and APU charts.
One metal, two pots
Database, compute and storage units are three projections of the same servers, so the room left for one unit depends on what the others already hold. Replication-manager keeps one physical ledger per axis, cores, memory, IOPS and NVMe disk, and derives two pots from it, shown on the Resource Manager page:
- the plan pot is the sellable capacity, capacity times the quota, minus every plan already sold, whatever the unit. A plan is a guarantee, so only other plans can bind it: a plan increase is admitted when it fits this pot, and consumption plays no role.
- the over-commit pot is the whole capacity minus every plan minus everything already borrowed above a plan. An existing plan may grow beyond itself into this pot only. It is a loan, never a sale.
The rule of precedence: a plan increase always wins over borrowed resources. A sale can leave the over-commit pot negative; the instance then reports it, refuses any further loan, and the borrowed part must give way.
Price ratios around the plan
A plan is a commitment, so a unit family with a plan is not billed flat. Two ratios, global to the replication-manager instance (Settings → Marketplace), make the price asymmetric around the plan, in percent of the unit price:
cloud18-marketplace-overcommit-price-pct, default 150: the surcharge on a unit consumed above the plan. At 150 such a unit costs 2.5 times the unit price.cloud18-marketplace-undercommit-price-pct, default 80: the reduction on a plan unit left unconsumed. At 80 such a unit costs 0.2 times the unit price.
With a plan P, a consumption C in whole units and a unit price U, the month costs P × U + (C − P) × U × 2.5 when C is above P, and C × U + (P − C) × U × 0.2 otherwise. Setting both to 0 gives a flat bill of the plan or the consumption, whichever is larger. The ratios apply to every family with a plan, DBU, APU and BKU. The BAU has no plan and is billed on usage alone, so the ratios never touch it.
What an application consumes at least
On an OpenSVC v3 cluster the consumption of applications and proxies is read from the
orchestrator itself: every service is its own cgroup, and the daemon of each agent publishes
its cpu time and memory, refreshed every fifteen seconds. Replication-manager reads that page
every ten monitoring ticks, nothing is installed in the services. Measured cpu and memory
raise the bill of a unit above its floor; disk is not measured there, it is billed from the
declared size as described below. The switch is monitoring-system-resources.
A running application or proxy is never billed under one APU, whether or not its consumption is measured. In flex topology an application runs one instance per agent behind the load balancer and counts at least one APU per agent. In failover topology it runs one instance and counts one APU: the standby agents hold a copy of its volume, no cpu, no memory. A proxy counts at least one. Measured consumption only raises the bill above that floor. A stopped unit counts nothing, and its plan unit is billed at the under-commit rate. The plan of an application follows the same rule: its size, at least one APU, times its running instances.
The disk of an application is billed apart, in storage units that carry no cpu and no
memory: its declared prov-app-disk-size times the agents holding a copy, rounded up per
application. An ordinary application counts it in BKU, on the cluster's plan. A storage
application, one flagged S3 Provider in its settings such as minio hosting an archive for
other clusters, counts it in BAU as producer, with no plan. Every unit bills from its
declared setting, the same way a database bills prov-db-disk-size; nothing is read back
from the orchestrator.
From a unit to a running service
- The plan is set in units, per member.
prov-db-dbuis the DBU count of each database,prov-proxy-aputhe APU count of each proxy or application. The cluster totals,prov-service-plan-dbuandprov-service-plan-apu, are those numbers times the member count, recomputed every tick: they are the plan lines on the graphs. A plan change (APIChangePlanUnits, or the plan slider) moves the per-member number by whole units, floor 1. - The unit is unfolded into resources at the fixed ratio. N DBU on a database becomes
prov-db-cpu-cores = N,prov-db-memory = N × 4096 MB,prov-db-disk-size = N × 20 GB,prov-db-disk-iops = N × 1000; N APU on a proxy becomes N cores, N × 2048 MB, N × 10 GB and no IOPS. From there the unit is gone: everything downstream readsprov-db-*andprov-proxy-*. The log line "Plan DBU N/db -> resources aligned to …" records the unfolding. - The resources are deployed by the orchestrator. On OpenSVC they land in the service
file: image and run arguments, volume size, and either
--cpus/--memoryin the docker run arguments or, withprov-db-docker-run-args-limitoff, the process-group keywordspg_cpu_quota/pg_mem_limit. On Kubernetes they become the Deployment's requests and limits and the volume claim size. On-premise they only size the database, nothing is provisioned. - The same numbers size the database itself. The configurator derives the server
configuration from
prov-db-memoryandprov-db-cpu-cores: buffer pool and the other memory areas through the shared and threaded memory percentages, thread pool, IO threads, IO capacity from the IOPS. A DBU is both the container envelope and the tuning of what runs inside it; that is why the ratio is locked. - Consumption comes back in the same unit. The sensor reads the service cgroup, cores used, memory, IO, disk, and divides each axis by the ratio; the pivot is the axis that binds. That consumed DBU is what the graph bars show, what the dynamic resize compares with the configured resources, and what counts as usage above the contract past the plan. Proxies and applications are measured the same way, in APU, through their sidecar.
- The dynamic resize moves step 2 only. A grow or a shrink changes
prov-db-cpu-coresorprov-db-memoryby whole units, the orchestrator applies it live, the configurator re-tunes the database, and the plan stays where you put it.
Hook scripts
Every step above can be observed or overridden by a script you own. All scripts receive the cluster name; values are passed in the environment so a shell script needs no parsing.
| Script | When it runs | Arguments | Environment | Effect of its exit code |
|---|---|---|---|---|
prov-plan-increase-script |
after a plan change in units (step 1) | unit from to cluster |
REPMAN_PLAN_UNIT (DBU or APU), REPMAN_PLAN_FROM, REPMAN_PLAN_TO, REPMAN_CLUSTER |
informational: the plan has already changed (ticketing, notification, your own accounting) |
prov-db-dynamic-resource-can-change-script |
before every live resize of a database (step 6) | host port direction cluster |
REPMAN_RESIZE_DIRECTION (grow or shrink), REPMAN_PROV_DB_MEMORY, REPMAN_PROV_DB_CORES, REPMAN_PROV_DB_DISK_SIZE, REPMAN_PROV_DB_DISK_IOPS, REPMAN_SERVER_HOST, REPMAN_SERVER_PORT |
prints its verdict on stdout: yes (resize in place), no (keep the current size), migration (the host lacks capacity, the instance must move) |
prov-db-dynamic-resource-change-script |
instead of the native backend, to apply the resize (step 3 done by you) | host port direction cluster |
same as above | non-zero exit = the resize failed; the database configuration is not raised over a container that did not grow. Mandatory on-premise, localhost and SlapOS for a live resize; without it those fall back to a restart |
prov-db-resource-raised-over-plan-script |
when an automatic grow would take a database past its plan, after the envelope and the pool allowed it | host port cluster |
REPMAN_CLUSTER, REPMAN_SERVER_HOST, REPMAN_SERVER_PORT, REPMAN_PLAN_DBU, REPMAN_TARGET_DBU, REPMAN_BORROW_DBU (target minus plan) |
non-zero exit vetoes the over-plan grow; the refusal is reported as ERR00112 |
The provisioning hooks that create and destroy services (prov-db-bootstrap-script,
prov-db-cleanup-script and the others) are documented in the Orchestrators → Scripts
page; they are not involved in a live resize.
What it does
With dynamic resources enabled, replication-manager resizes a database's CPU and memory while it runs, following the load it measures on the database's own cgroup:
- when a server saturates a resource, the resource grows by one unit;
- when every server of the cluster under-uses a resource, it shrinks back to what the load needs;
- the plan is your resource contract: the underlying platform guarantees that the plan can always be served by a real hardware reservation. The resize never changes it. Growing past the plan is allowed within an envelope, as long as the node has the resources to lend; the plan itself is only ever raised by you.
Resources are counted in DBU (Database Units): 1 DBU = 1 core, 4 GB of memory, 20 GB of disk, 1000 IOPS. A resize moves by whole DBU on the axis that is binding.
Requirements
- An orchestrator with a live resize primitive: OpenSVC v3 (the service process group) or Kubernetes 1.33+ (in-place Pod resize). On-premise, localhost and SlapOS can only resize through your own script, or at the next restart.
- The resource sensor on (
monitoring-system-resources, default on): it reads the service cgroup and produces the consumed DBU the decisions are based on. The sensor pushes one reading per run of the database jobs (about every minute); a reading older than 3 minutes counts as no reading, and every decision waits until readings flow again (see "Limits and known behaviour"). - On OpenSVC, the cap must live on the process group, not on the docker run arguments:
set
prov-db-docker-run-args-limit = falseand rolling-restart once so the containers are recreated resize-ready. Until then WARN0214 tells you the live move cannot bind.
Turning it on
[mycluster]
prov-db-dynamic-resource = true
prov-db-docker-run-args-limit = false   # OpenSVC: cap on the process group
prov-db-dbu = 1                         # the plan, per database
In the dashboard: the plan is the DBU slider under Configurator → Database Configurator →
Resources, the switch is Apply Dynamic Resource Resize under Settings → Dynamic Config
next to the tuning settings below (margins, overcommit, speeds, resize policy), and
prov-db-docker-run-args-limit is only in the configuration file.
How a grow happens
Disk moves too. On OpenSVC v3 a moved declared disk, from the follow rule when a datadir outgrows it, from the shrink rule when every node sits well under it, from the setting or from a plan change on the disk axis, resizes the data volume of every running database through the orchestrator's resize action, no reprovision. When the orchestrator refuses a move, the reason is shown as WARN0220 on the server until a later move goes through. The volume must carry a quota for the size to bound anything, which the shared volume template sets at provisioning. Today's orchestrator only grows a volume: a shrink moves the declaration and leaves the volume where it is, shown as WARN0221 on the server until an orchestrator release lowers the quota to the declared size. A shrink never rebuilds anything: it is data.
Every monitoring tick, each server's consumption is compared with its configured resources.
- A server is saturated on an axis when it uses at least
100 - prov-db-cap-safety-pctpercent of it (default 85 %), forprov-db-scale-up-config-in-plan-speed(default 1m). - One saturated server is enough: the cluster grows that axis by one DBU on every database (CPU first when cores are pinned, then memory, then IOPS when a memory step stopped improving throughput).
- Within the plan the step is always free. Past the plan it must fit:
- the overcommit envelope
prov-db-overcommit-pct(default 50): never above ceil(plan × 1.5) DBU per database; - the free pool of the node;
- your own veto script
prov-db-resource-raised-over-plan-script, if set.
- the overcommit envelope
- If the step is refused, nothing changes and the cluster carries the error ERR00112 in the Workload panel with the reason, until a later step succeeds or the load drops. To go further, raise the plan or the overcommit percentage.
One step per window: the next grow is evaluated after prov-db-scale-up-config-in-plan-speed.
IOPS shrinks to the plan. The IOPS declaration is a cap on the database, pure configuration.
When every node has stayed well under its configured IOPS for prov-db-scale-down-config-in-plan-speed,
prov-db-disk-iops comes back in one move, aligned to the unit, to the larger of the plan's IOPS and the
peak usage plus the safety margin, never under the plan. Only a genuine IO bottleneck grows it again.
Disk follows usage both ways. The declared prov-db-disk-size is what the volume's quota
bounds. Since 3.1.43, when the measured datadir of a node is over the configured disk, the
configuration follows reality: prov-db-disk-size becomes the largest node's usage in whole
gigabytes, no rounding to the unit, within the plan for free, past the plan through the same
envelope as the other axes. And when every node has stayed well under the configured disk
for prov-db-scale-down-config-in-plan-speed, the disk shrinks back in one move, aligned to
the unit, to the larger of the plan's disk and the peak usage plus the safety margin: the
plan is the floor, a database never gets less disk than its plan promises, whatever the
undercommit allowed on cores and memory.
How a shrink happens
- An axis is under-used when a server uses at most
prov-db-cap-shrink-pctpercent of it (default 50 %), forprov-db-scale-down-config-in-plan-speed(default 5m). - Every database of the cluster must be under-used: one busy server blocks the shrink.
- The axis is then set, in one move, to the smallest whole DBU that keeps every server's peak consumption under the saturation mark. A 4-core database using 0.2 core goes straight to 1 core; a 2-core database with a 1.0-core peak stays at 2, because 1 core would be saturated at once.
- The floor depends on the axis. Cores and memory may go under the plan down to the
undercommit floor
prov-db-undercommit-pct(default 50): floor(plan × 0.5) DBU per database, never under 1 DBU. Disk and IOPS are caps, not consumption: they come back to the plan and never under it.
One axis per tick, in this order: memory, cores, disk, IOPS. A memory shrink lowers the InnoDB buffer pool first and the container limit only once the pool has actually released the memory, so the database is never squeezed below what it holds.
Per axis: what grows, what shrinks
| axis | grows when | step | shrinks when | shrink target and floor | what moves |
|---|---|---|---|---|---|
| cores | one server saturated on cpu for the scale-up window; cores have priority, nothing else moves throughput while they are pinned | +1 core, over plan within the envelope, the node pool and your veto script | every server under-used on cpu for the scale-down window | smallest whole DBU keeping the peak under the saturation mark, down to the undercommit floor | the container's cpu quota, then thread_pool_size and innodb_read_io_threads live |
| memory | InnoDB buffer-pool pressure sustained for the window, not occupancy | +1 DBU of memory, clamped to the container cap, over plan within the envelope | every server under-used on memory for the window | same rule and floor as cores | the buffer pool live, the container limit once the memory is free; redo log follows |
| IOPS | IO saturated, taken only after a memory step bought no throughput | +1000 IOPS, over plan within the envelope | every server under-used on IO for the window | the plan or the peak plus margin, never under the plan | innodb_io_capacity and _max, write threads; no container primitive |
| disk | the datadir outgrows the declaration | follows the usage in whole GB, applied first and alone | every server under-used on disk for the window | the plan or the peak plus margin, never under the plan | the declaration and the volume through the orchestrator, grow only until the orchestrator can shrink a volume (WARN0221) |
Nothing here touches the plan: the plan is the contract, these rules move the resources around it, and the bill reads the resources as declared.
The redo log follows, since 3.1.43. On every memory move the InnoDB redo log is resized live
with the buffer pool, to a quarter of it rounded to a power of two (128 MB at least, 16 GB at most),
on MariaDB 10.9 and later (innodb_log_file_size) and MySQL or Percona 8.0.30 and later
(innodb_redo_log_capacity). It is the last statement of the move, after the buffer pool.
Older database releases keep their redo until the next restart, and the move marks the
database as needing one. Up to replication-manager 3.1.42 the redo is never resized live,
whatever the database release: it takes the size of the generated configuration at the next
restart. A redo grow needs the new file's worth of free disk during the switch; a redo
shrink under heavy writes can take a while, the checkpoint has to pass the new end first,
but it does not block the workload.
Between 50 % and 85 % of the configured resources nothing moves: this dead band avoids oscillation.
Memory shrink: OpenSVC and Kubernetes differ
On OpenSVC the memory cap is the service process group. Lowering it is a live cgroup change, and because replication-manager lowers the buffer pool first and waits for the memory to be released, the new limit never sits below what the database holds. The node gets the memory back at once.
On Kubernetes the memory limit can only be raised in place. Lowering memory.max
under a running container would force the kernel to reclaim, and to OOM-kill the process
if it cannot, so with the default resize policy (NotRequired) the kubelet reports the
decrease as Infeasible and leaves the live limit where it was. replication-manager
then applies the shrink at the next restart of the database: the Pod spec already carries
the lower value, and the buffer pool has already been reduced by SQL. Until that restart the
old amount stays booked on the node, since requests equal limits, so the memory the
database no longer uses is not available to other Pods.
To have shrinks apply without waiting, set the memory resize policy of the database
container to RestartContainer:
resizePolicy:
  - resourceName: memory
    restartPolicy: RestartContainer
A memory shrink then becomes a container restart, which replication-manager sequences
as any restart (restart cookie, rolling restart), and prov-db-dynamic-resize-policy = daily-time confines it to a quiet window. The trade is an immediate release of node
memory against a restart on each shrink: a reasonable choice for replicas, rarely for the
primary. This is one of the reasons to prefer OpenSVC when the workload needs its
resources to follow the load in both directions.
What you see
- Graphs → Consumed DBU: the bars are the real consumption per axis; the dashed plan line is your contract; a dotted configured line appears when the configured resources differ from the plan, marked "(over plan)" when they sit above it.
- Workload panel: CINF0007 (a server saturates its resources), CINF0008 (a server under-uses them), WARN0213 (consumption at the plan for a long time: consider raising the plan by hand), ERR00112 (an automatic grow was refused, with the reason).
- WARN0214: dynamic resources are on but the container is still capped by the docker run arguments, the live move cannot take effect.
- WARN0215: the sensor has not reported for more than 3 minutes (a long backup or other database job is running in the jobs container, or that container is down), or on Kubernetes the sensor prerequisites are missing. Nothing is resized while it stands, and the Consumed DBU graph shows a gap for the silent period. It clears on the next reading.
- WARN0220: the orchestrator refused a disk move on that server, with its reason; the volume keeps its size, the declared disk was saved, the next move asks again.
- WARN0221: the declared disk went down but the volume did not follow: the orchestrator in place only grows a volume. Clears when a later resize lands the volume at the declared size.
- The resize history (dimension, direction, applied or not, statements run) is kept in the resource resize log of the cluster.
What it looks like
Three sysbench runs on a three-node test cluster, plan 1 DBU per database, prov-db-cpu-cores
starting at 1 before each run, captured on the dashboard over the same two hours:
| run | client threads | replication threads | avg TPS | avg latency |
|---|---|---|---|---|
| 1 | 32 | 2 | 662 | 48 ms |
| 2 | 32 | 32 | 668 | 48 ms |
| 3 | 128 | 32 | 1306 | 98 ms |
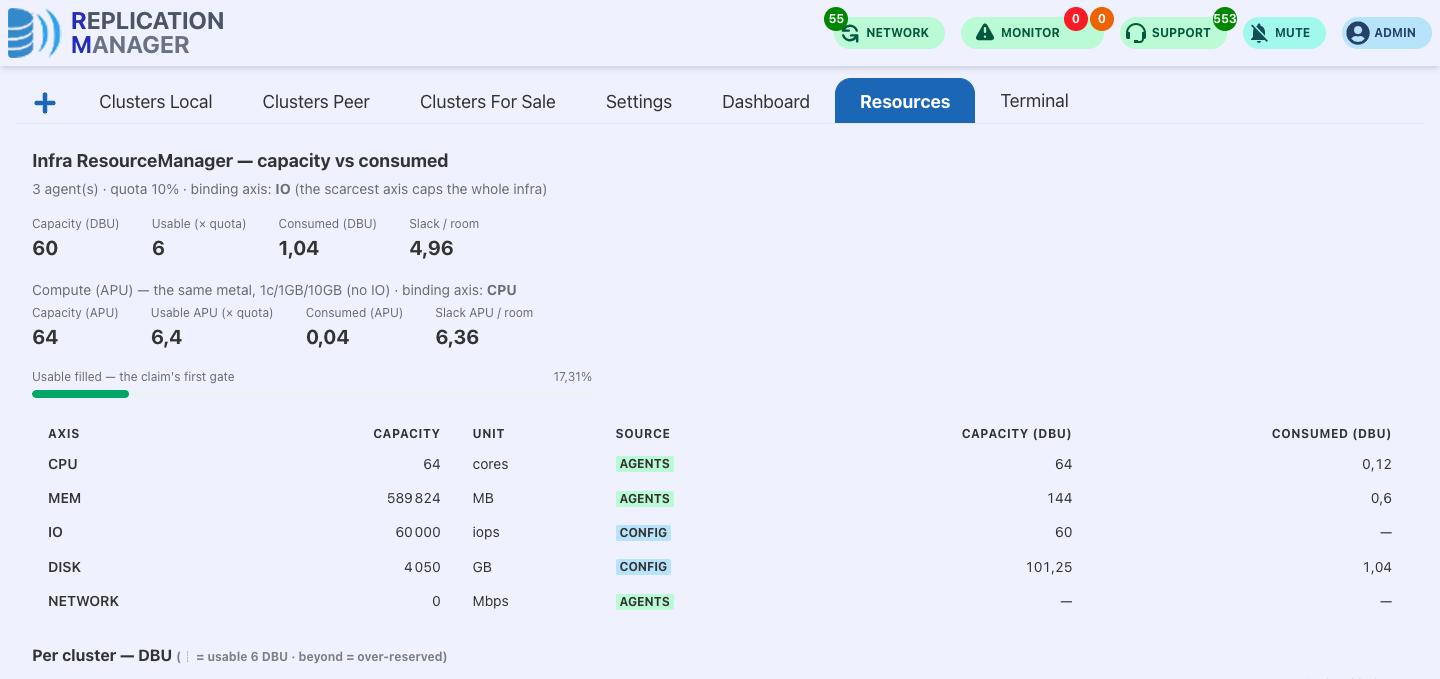
The Resource Manager setup behind these numbers. The instance runs with
resource-manager-infra-quota-pct = 10: repman may allocate 10 % of the three agents' metal
(default 90). The three agents add up to 64 cores and 576 GB, which the ratios turn into
60 DBU of capacity on the scarcest axis, IO, so the usable pool is 6 DBU and 6.4 APU. The
dev3 plan of 3 DBU sits inside that pool; the runs below borrow from the rest of it.
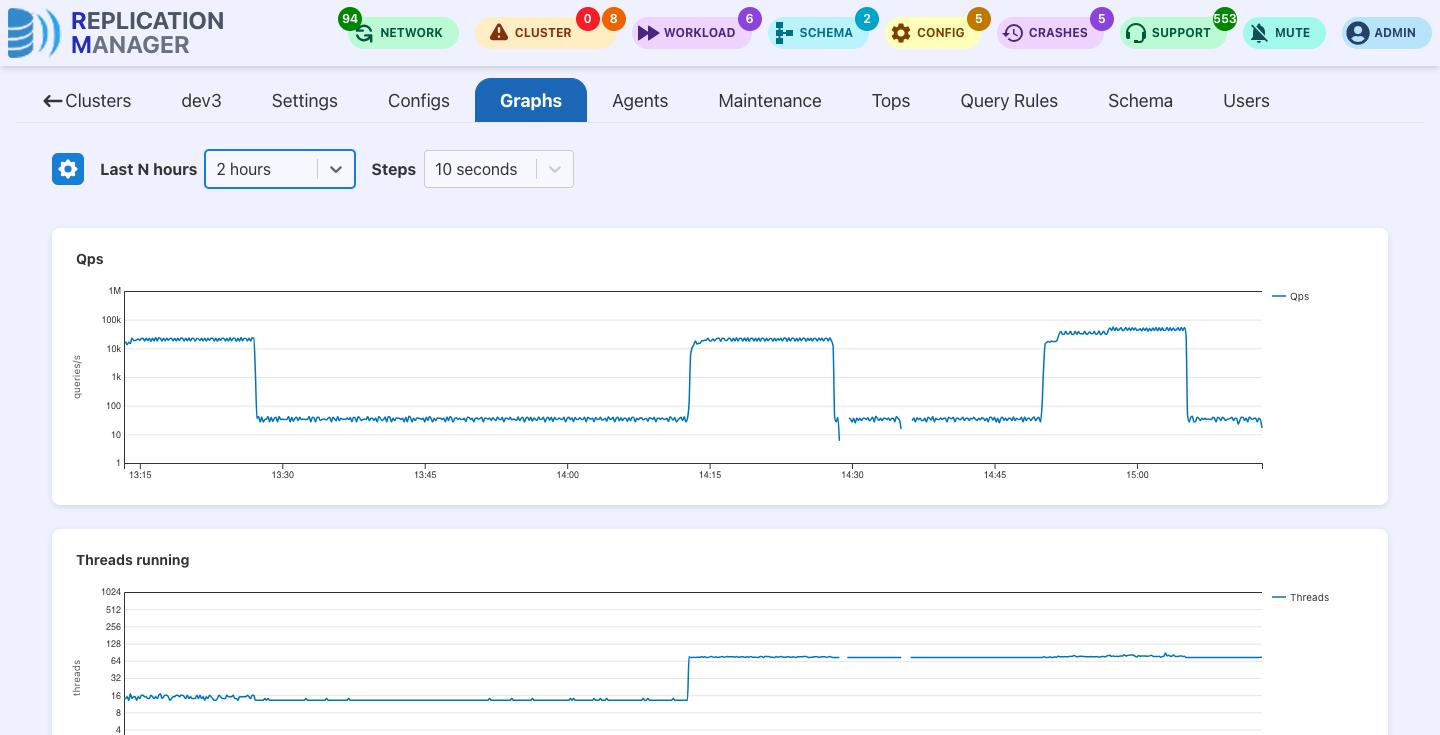
Cluster → Graphs, Queries per second. Runs 1 and 2 plateau at about 15k qps on the master whatever the cores: with 32 clients the bottleneck is the round trip between the client and the proxy, not the database. Run 3, with 128 clients, reaches 27k, drops to 16k while the slaves are capped at 2 cores and the envelope refuses the third one, and climbs to 35k once the envelope is widened and the cluster grows to 3 cores.
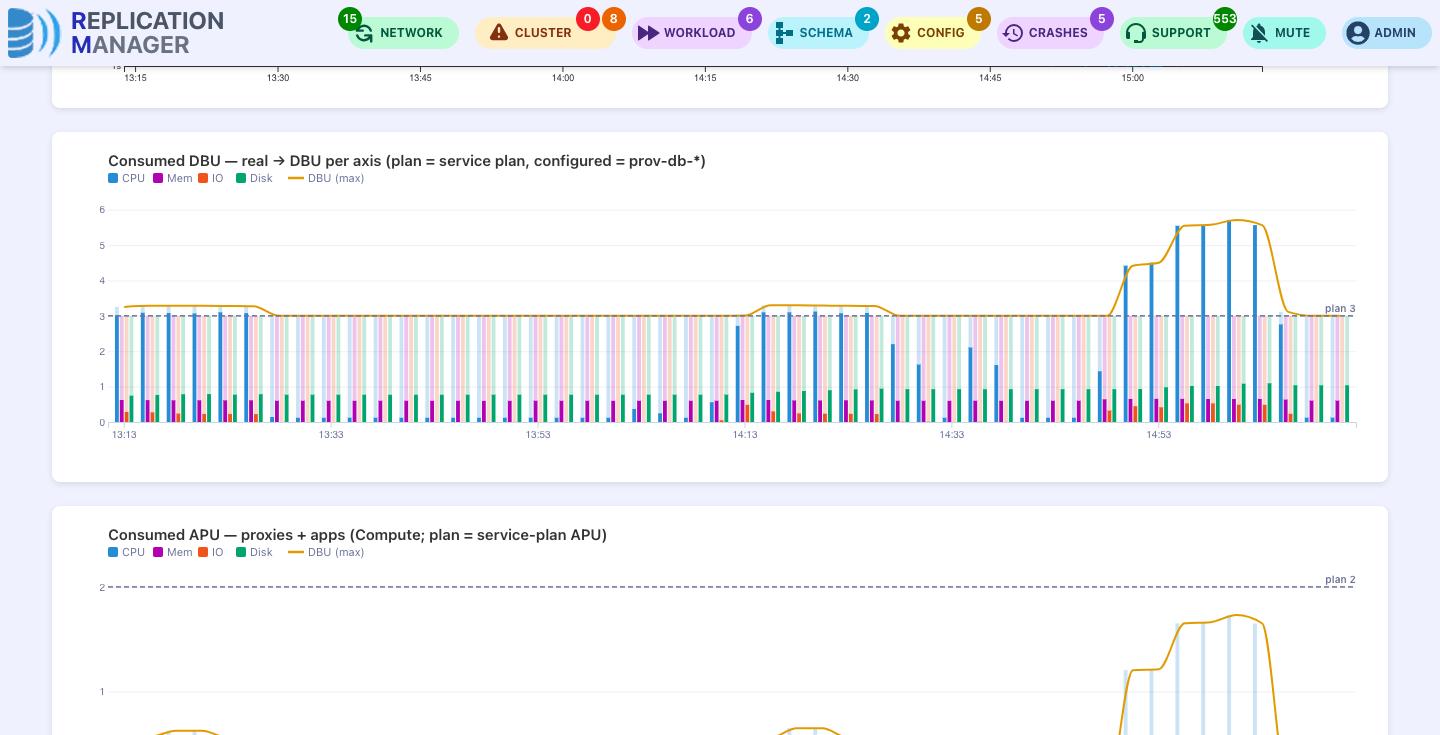
Cluster → Graphs, Consumed DBU. The bars are the real consumption per axis, the orange line the DBU pivot, the dashed line the plan. Runs 1 and 2 barely cross the plan; run 3 climbs to almost 6 DBU, twice the plan, as the cluster grows to 3 cores per database, then falls back when the load stops and the shrink aligns the configuration down.
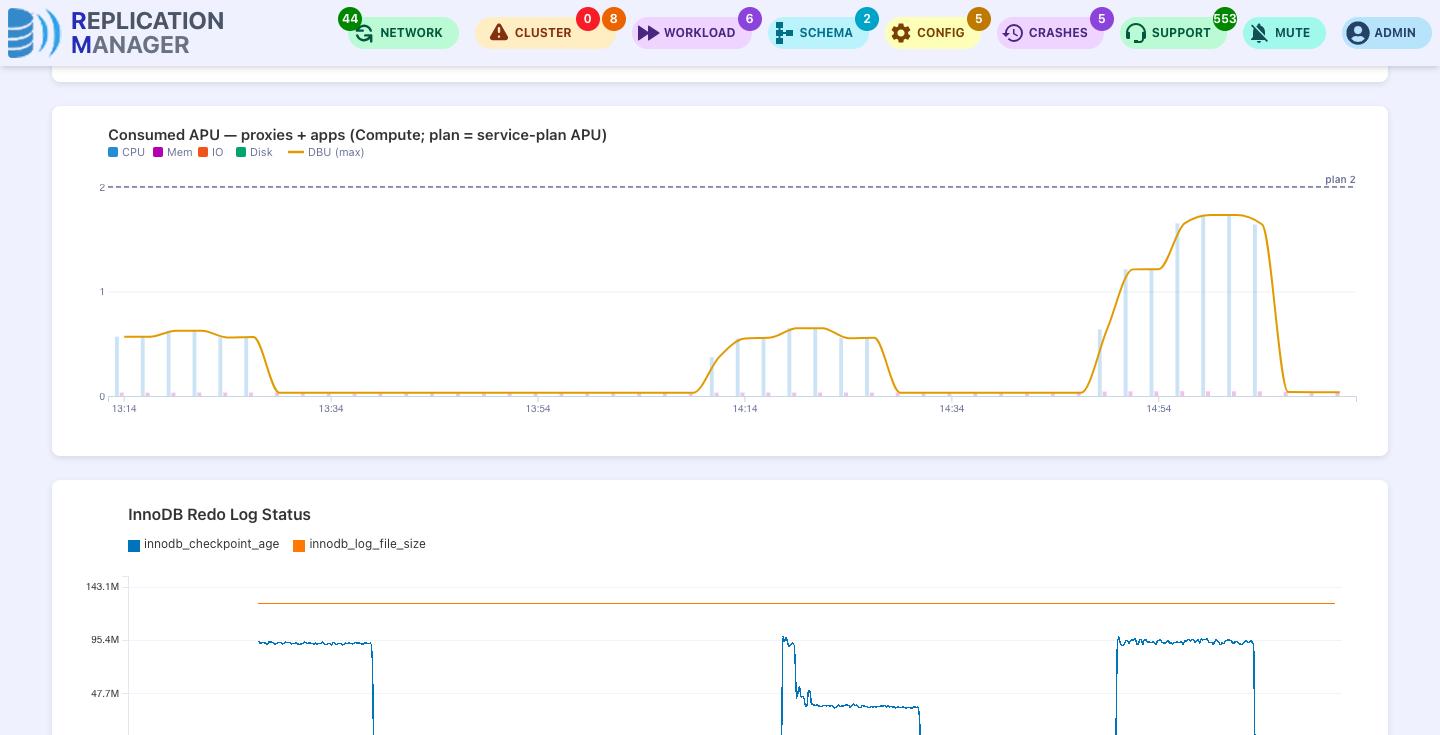
Cluster → Graphs, Consumed APU. The proxy follows the same shape in APU: 0.5 under 32 clients, 1.6 under 128, well inside its plan of 2.
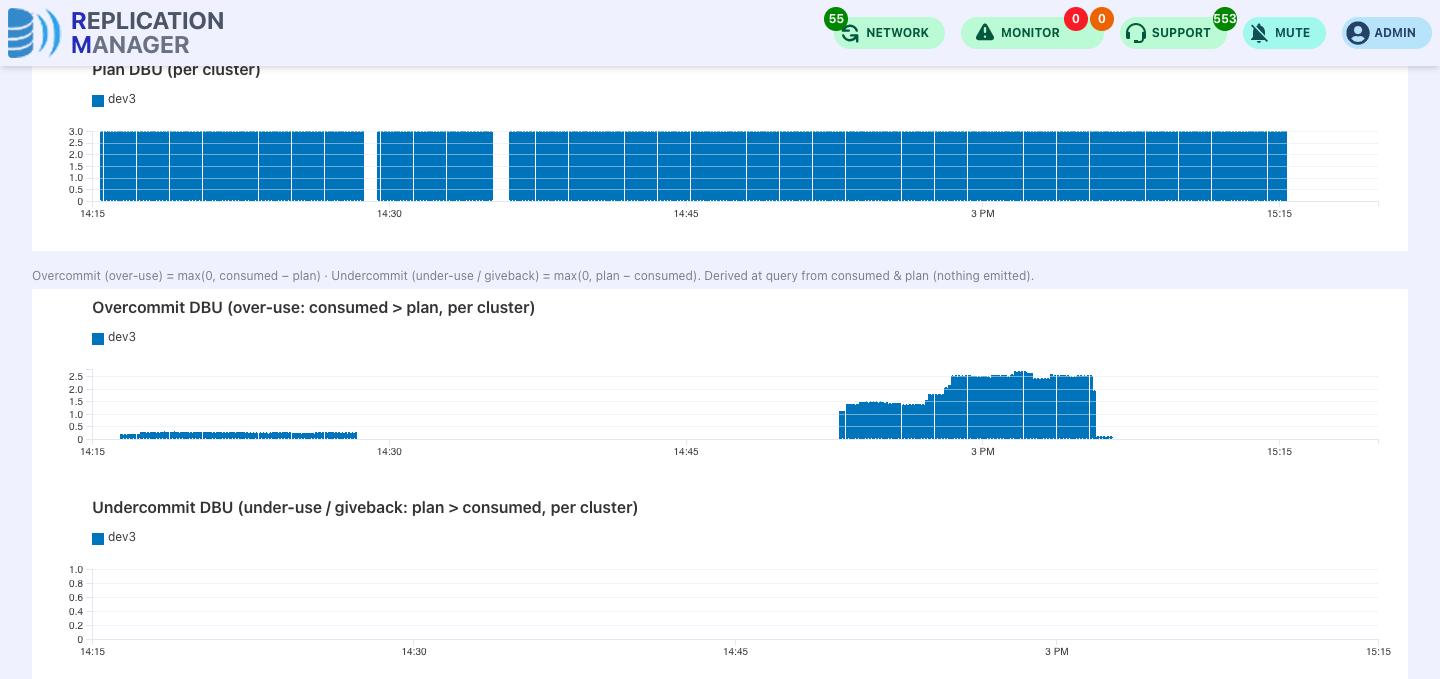
Resources, Overcommit DBU. The derived history of consumption above the plan: a few tenths of a DBU during runs 1 and 2, up to 2.7 DBU during run 3. This is usage above the contract, served from the node pool.
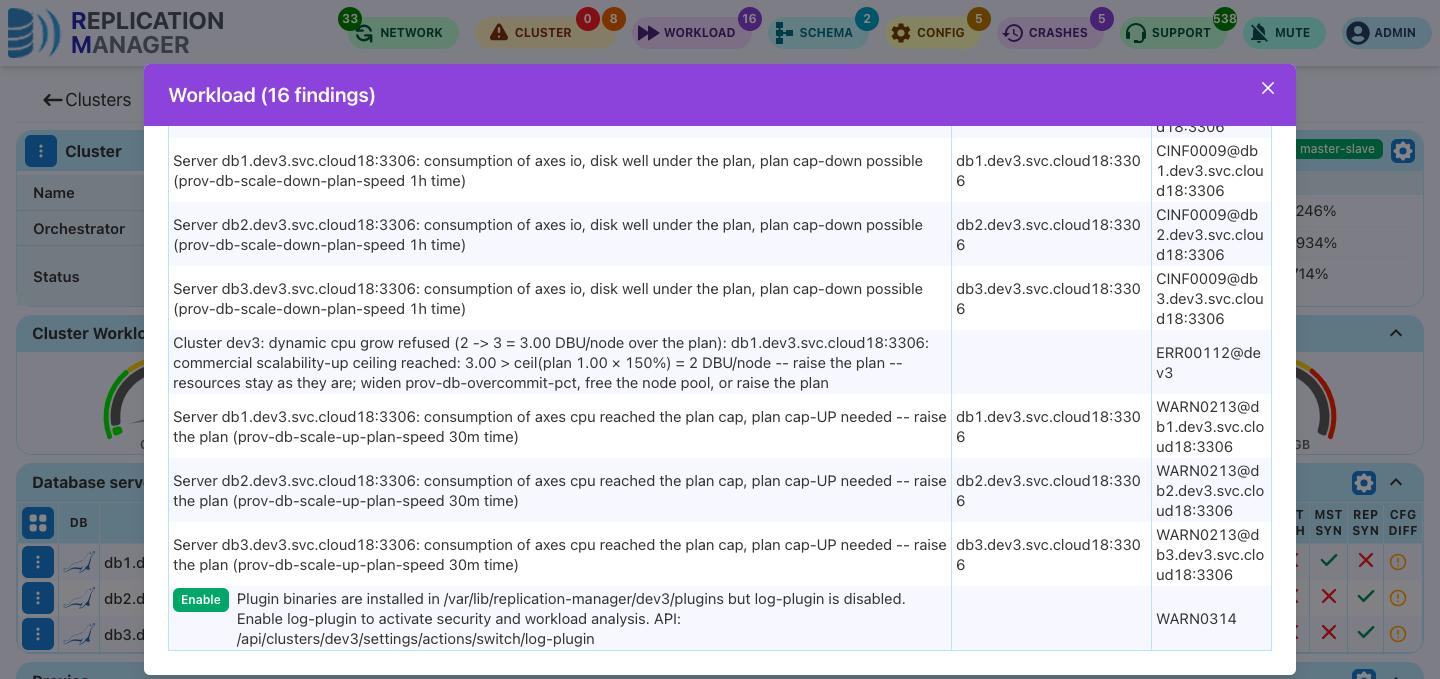
Workload panel. When the envelope was reached during run 3, the next automatic step was refused and reported as ERR00112 with its reason, next to WARN0213, the information that consumption sits at the plan and that the plan may be raised by hand.
The resize log. Every attempt, applied or not, is a record in the cluster's
resource_resize.log (JSON, one line per server and attempt, in the cluster working
directory). The master's records for run 3, condensed:
12:51:45  db1  cpu  grow    applied=true   feasibility=yes  cores=2   <- saturation on 1 core
12:53:57  db1  cpu  grow    applied=false  feasibility=no   cores=2   <- envelope reached (ERR00112)
12:57:01  db1  cpu  grow    applied=true   feasibility=yes  cores=3   <- overcommit widened to 200 %
13:10:43  db1  cpu  shrink  applied=true   feasibility=yes  cores=1   <- idle: aligned to the DBU in one move
Settings
| Setting | Since | Default | Meaning |
|---|---|---|---|
prov-db-dynamic-resource |
3.1.42 | false | Enable the live resize |
prov-db-docker-run-args-limit |
3.1 | true | Cap at the docker level; set false on OpenSVC so the process group can be resized live |
monitoring-system-resources |
3.1.42 | true | The resource sensor (global setting) the decisions read |
prov-db-dbu |
3.1.42 | The plan, in DBU per database | |
prov-db-cap-safety-pct |
3.1.42 | 15 | Saturated at 85 % of the configured resource |
prov-db-cap-shrink-pct |
3.1.42 | 50 | Under-used at 50 % of the configured resource |
prov-db-overcommit-pct |
3.1.42 | 50 | Grow ceiling: up to ceil(plan × 1.5) DBU per database |
prov-db-undercommit-pct |
3.1.42 | 50 | Shrink floor: down to floor(plan × 0.5) DBU per database, min 1 |
prov-db-scale-up-config-in-plan-speed |
3.1.42 | 1m | How long saturation must last before a grow |
prov-db-scale-down-config-in-plan-speed |
3.1.42 | 5m | How long under-use must last before a shrink |
prov-db-scale-up-plan-speed |
3.1.42 | 30m | How long consumption must sit at the plan before WARN0213 |
prov-db-dynamic-resize-policy |
3.1.42 | scale-speed | daily-time defers the memory move to prov-db-dynamic-resize-daily-time (03:00) |
prov-db-dynamic-resource-can-change-script |
3.1.42 | Your feasibility check before a move (prints yes, no or migration) | |
prov-db-dynamic-resource-change-script |
3.1.42 | Your own resize hook, replaces the native backend | |
prov-db-resource-raised-over-plan-script |
3.1.42 | Your veto on a grow past the plan (non-zero exit refuses) |
Database releases and the memory resize
A CPU resize is harmless for the workload: it re-tunes the thread pool and the IO threads and
moves the container limit. A memory resize changes innodb_buffer_pool_size on the
running server, and that operation depends on the database release.
| Release | Live buffer pool resize | What to expect |
|---|---|---|
| MariaDB 10.2.2 → 10.11.11, 11.4.0 → 11.4.5, 11.8.0 → 11.8.1, and MySQL 5.7.5 → 8.x | yes, in chunks (innodb_buffer_pool_chunk_size) |
the resize blocks the workload: the server waits for running transactions to finish, and new transactions that need the buffer pool wait until the resize is complete; nested transactions started during the resize may fail. A shrink, which withdraws pages, is the longest. |
| MariaDB 10.11.12+, 11.4.6+, 11.8.2+ (MDEV-29445, chunks removed) | yes, up to innodb_buffer_pool_size_max |
the buffer pool can only grow up to innodb_buffer_pool_size_max, a read-only startup variable that defaults to the size the server started with: a live grow above it is refused with warning 1292 and nothing changes. Set innodb_buffer_pool_size_max at startup to the largest size the database may grow to. A shrink may not release the memory to the system (MDEV-32339), so the container limit is lowered only once the memory is actually free. |
| PostgreSQL | no (shared_buffers is startup-only) |
the memory resize is applied at the next restart |
| Redo log, since replication-manager 3.1.43: MariaDB 10.9+, MySQL/Percona 8.0.30+ | yes, with the buffer pool (last statement of the move) | older database releases, and replication-manager up to 3.1.42, keep the redo until the next restart |
| Older MariaDB (< 10.2.2) and MySQL (< 5.7.5) | no | restart |
Because of the first row, on releases that still use chunks prefer
prov-db-dynamic-resize-policy = daily-time with prov-db-dynamic-resize-daily-time set to an
off-peak hour: the memory move is then applied once a day at that time, after any running
backup or maintenance job, instead of at the moment the load saturates. CPU and IOPS moves
are not affected by the policy and stay immediate.
Limits and known behaviour
- Kubernetes cannot decrease memory in place with the default resize policy: a memory
shrink is applied at the next restart, or at once with
RestartContainer(see "Memory shrink: OpenSVC and Kubernetes differ"). CPU moves both ways. - IOPS are tuned in the database only; there is no live IO cap on the container.
- The sensor runs inside the database jobs cycle, so a long job (backup, reseed, optimize) silences it for its whole duration. Since 3.1.42 a reading older than 3 minutes is treated as no reading: the decisions stand still, WARN0215 says why, and the graph shows the gap rather than a frozen value. Before that release the last reading stayed in force and a shrink or grow could fire on it during the job. A memory move is also never applied on a server while a job runs there.
- On MariaDB 10.11.12+, 11.4.6+ and 11.8.2+ the live memory grow is bounded by
innodb_buffer_pool_size_max(see the releases table); until replication-manager sets it at startup from the plan and the overcommit envelope, a database started small cannot grow its buffer pool live beyond its startup size. - A resource declared in the static cluster file is immutable: a dynamic move on it is kept
only until the next restart. Leave
prov-db-cpu-coresandprov-db-memoryout of the static file when you enable dynamic resources.
GWU: the gateway network unit (3.1.43)
The Cloud18 gateways share one uplink, so the bandwidth every cluster takes through them is tracked in GWU, a bandwidth unit, and not invoiced unless you set a price.
| term | definition |
|---|---|
| unit | 1 GWU = cloud18-marketplace-gwu-unit-mbit Mb/s, 100 by default: a 1000 Mb/s gateway is 10 GWU |
| capacity | cloud18-gateway-bandwidth-mbit, one value per gateway (comma-separated, aligned with the gateway services, one value applies to all), 1000 by default |
| plan of a cluster | the gateway capacity divided by the clusters present on the gateway (at least one routed app), in GWU; prov-gateway-units pins it when you want a fixed plan |
| consumed | the cluster's traffic in and out through the gateways, in Mb/s, divided by the unit |
| borrowed / given away | consumed above / below the plan, integrated over the month like DBU and APU |
replication-manager reads every gateway's HAProxy stats port (<gateway domain>:8404), attributes
the bytes to the cluster named in each backend, handles the counter resets of a gateway reload, and
derives the rates between two polls. Series: gwu.<cluster>.mbps, plan_mbps, units, plan,
bytes (the octets of the month, information), and gateway.<domain>.mbps, capacity_mbps,
utilization_pct. The Resource Manager page gives the gateway its own GWU section, like APU and BKU: consumed GWU per
cluster under the capacity line, plan, overcommit (borrowed) and undercommit (given away); when the
consumed stack reaches the capacity, the shared uplink saturates and every cluster slows down. The Graphs page has a Gateway
network section, the Maintenance page the plan, the consumption and the pin control, the user pill's
Consumed tab the GWU lines once a price (cloud18-marketplace-gwu-price) is set.
More bandwidth means another gateway with its own VIP, shared stick tables and DNS round robin.
What the back office receives
Everything is in bits, as every cloud expresses it. Every cluster may hold
cloud18-marketplace-gwu-free-units GWU of gateway bandwidth for free (10 by default, 1 Gb/s).
Bandwidth held above it is reported to the back office: in the statement as the borrowed line,
integrated over the month like DBU, at the plain cloud18-marketplace-gwu-price when one is set,
nothing credited below the allowance, nothing ever blocked; and as the cumulative traffic moved above
the allowance in Gbit (gwu.<cluster>.on_top_gbit). On a 1 Gb/s gateway nothing can be above the
allowance; it happens where the gateways give more. The GWU line is always in the statement, reaches the
back office with the closed month's Units statement pushed to GitLab, and shows in the user pill's
Consumed tab as a free line plus the on-top line.
Several gateways
cloud18-gateway-service and cloud18-gateway-domain-name accept comma-separated lists, order
aligned, for several gateways active at once: the app routes are published on every gateway,
two clusters sharing any gateway are checked for route conflicts together, and the app CNAMEs
point at the first domain of the list, under which the DNS round-robins the gateway VIPs. The
GWU reading sums every gateway.
Internal network: Mb/s per database, proxy and app (3.1.43)
GWU is the cluster seen from the gateway uplink. The internal network view is the same cluster seen from inside: what each database, proxy and app receives and sends on its own network interface, in Mb/s, in and out kept apart. It is monitoring only: no unit, no plan, no price, no alert. Its purpose is to show which unit holds the bandwidth when a node link saturates. On a private network such as an OVH vRack the traffic is unmetered, so the question is saturation, never cost.
The counters come from the same jobs scripts that already report the cgroup usage, so the path is identical on every orchestrator and on premise:
| unit | source | what is counted |
|---|---|---|
| database | the database jobs script reads the network counters of the database process | on OpenSVC the pod interface; on premise the database host interfaces, replication and backups included |
| proxy, app (OpenSVC) | the sensor sidecar of the service reads the pod interface | everything the pod moves |
| proxy (on premise) | the proxy's own counters (HAProxy, ProxySQL) | SQL traffic only, shown as source status |
The scripts report raw cumulative counters; replication-manager computes the rate, so a script
restart or a counter reset never produces a negative or inflated value. The Graphs page,
Resources section, shows two charts, "Internal network IN" and "Internal network OUT", each
stacked per service so the top of the stack is the cluster. The series are
net.<cluster>.<kind>.<unit>.rx_mbps and tx_mbps per unit, net.<cluster>.rx_mbps and
tx_mbps for the cluster.
Databases report as soon as the jobs script is refreshed, which replication-manager does on
its own. Proxies and apps report after their next reprovision, which installs the sensor sidecar.
The sidecar is governed by monitoring-system-resources, the same switch as the cgroup sensor.