Web Interface
3.3.1 Web Interface
Once replication-manager is started in monitor mode it exposes two HTTP listeners that serve the dashboard and REST API. The one you use depends on your deployment topology.
| Listener | Default port | Protocol | Default bind | Use case |
|---|---|---|---|---|
API server (api-port) |
10005 |
HTTP or HTTPS | 0.0.0.0 |
Direct browser and CLI access. Switches to HTTPS automatically when monitoring-ssl-cert is set. |
HTTP server (http-port) |
10001 |
HTTP only | localhost |
Reverse-proxy deployments — TLS is terminated at the proxy (nginx, HAProxy, Traefik). Serves the full dashboard and API over plain HTTP on the local interface. |
Which URL to open
| Deployment | URL |
|---|---|
| Default (no certificate) | http://<host>:10005 |
| With TLS certificate | https://<host>:10005 |
| Behind a reverse proxy | https://<proxy-host>/ → proxy forwards to http://localhost:10001 |
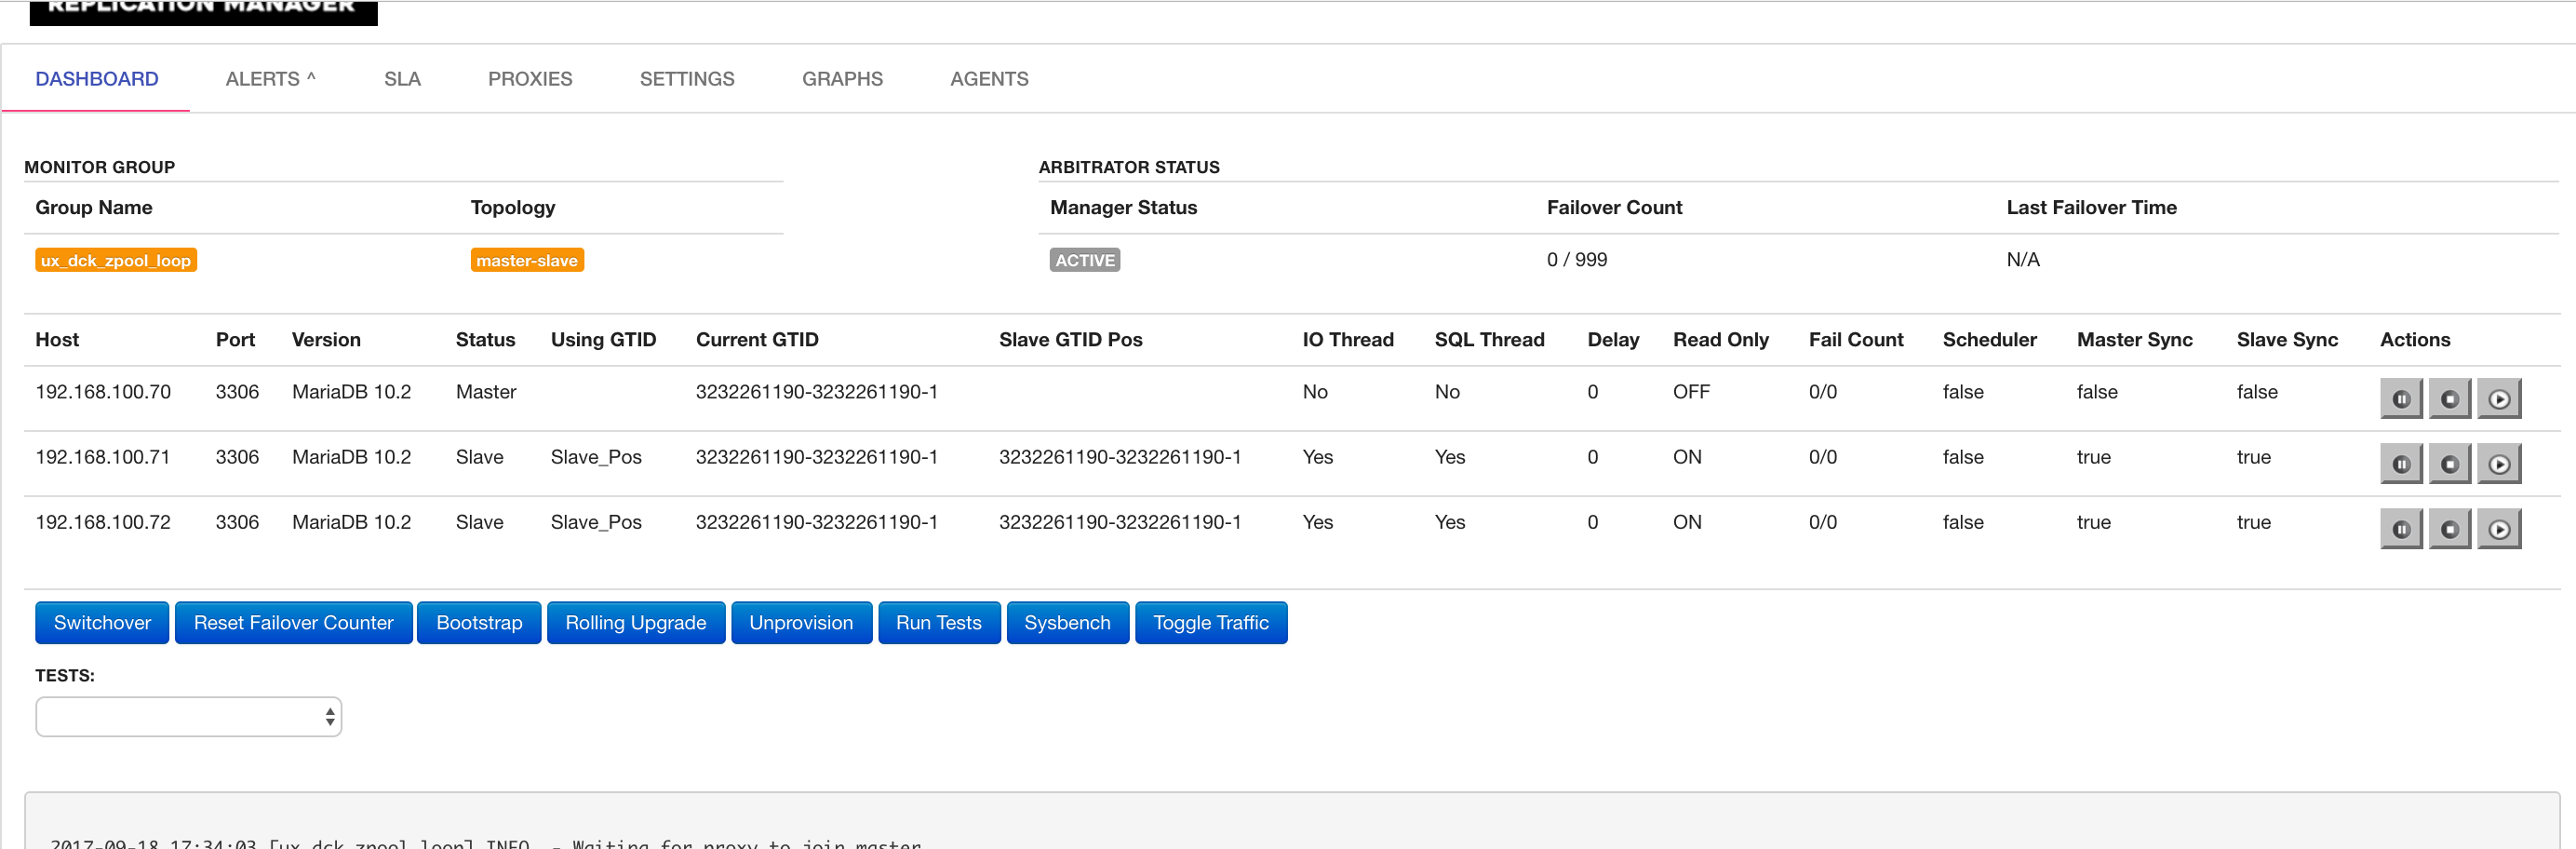
It looks like this:
3.3.2 Direct Access — API Server (port 10005)
The API server serves both the web dashboard and the REST API. Protocol depends on configuration:
- HTTP (default) — when no TLS certificate is configured
- HTTPS — when
monitoring-ssl-certandmonitoring-ssl-keyare set
When monitoring-ssl-cert is empty, replication-manager auto-generates a self-signed certificate. Browsers will warn on first visit — accept the certificate or install it in your trust store.
# Enable HTTPS on port 10005 with a real certificate
monitoring-ssl-cert = "/etc/ssl/repman/server.crt"
monitoring-ssl-key  = "/etc/ssl/repman/server.key"
api-bind            = "0.0.0.0"
api-port            = "10005"
3.3.3 Reverse-Proxy Access — HTTP Server (port 10001)
Port 10001 serves the full dashboard and API over plain HTTP. It is bound to localhost by default so it is not reachable from outside the host. A reverse proxy (nginx, HAProxy, Traefik) sits in front, terminates TLS, and forwards traffic to this port.
When api-https-bind = true the protected API endpoints (/api/monitor, cluster operations, alerts, Swagger) are removed from port 10001 — only unauthenticated endpoints remain (health, proxy checks, login). This is the recommended setting when running behind a reverse proxy so that bypassing the proxy does not expose the full API.
monitoring-ssl-cert |
api-https-bind |
Port 10005 | Port 10001 protected endpoints |
|---|---|---|---|
| Not set (default) | false (default) |
HTTP, full API | Yes |
| Set | false |
HTTPS, full API | Yes |
| Set | true |
HTTPS only | No — unauthenticated only |
3.3.4 Binding Configuration Reference
| Parameter | Default | Description |
|---|---|---|
api-port |
10005 |
Port for the API server (HTTP or HTTPS) |
api-bind |
0.0.0.0 |
IP address the API server binds to |
monitoring-ssl-cert |
"" |
Path to TLS certificate — activates HTTPS on api-port when set |
monitoring-ssl-key |
"" |
Path to TLS private key |
api-https-bind |
false |
When true, drops protected endpoints from the HTTP server |
http-port |
10001 |
Port for the plain-HTTP server (reverse-proxy use) |
http-bind-address |
localhost |
IP the plain-HTTP server binds to |
3.3.5 Reverse-Proxy Examples
nginx — TLS termination with full API on port 10001
server {
    listen 443 ssl;
    server_name repman.example.com;

    ssl_certificate     /etc/ssl/repman.crt;
    ssl_certificate_key /etc/ssl/repman.key;

    location / {
        proxy_pass         http://127.0.0.1:10001;
        proxy_set_header   Host $host;
        proxy_set_header   X-Real-IP $remote_addr;
        proxy_set_header   Upgrade $http_upgrade;
        proxy_set_header   Connection "upgrade";
    }
}
# replication-manager.toml
http-bind-address = "127.0.0.1"
http-port = "10001"
api-https-bind = truenginx — basic auth protecting the dashboard (legacy)
server {
    server_name repman.dashboard;
    location / {
        auth_basic           "Login required";
        auth_basic_user_file conf/htpasswd;
        proxy_pass           http://localhost:10001;
    }
}
This pattern predates the JWT-based authentication introduced in replication-manager 2.1. The built-in JWT login at
https://<host>:10005is now preferred for direct access. Basic-auth nginx proxying is still valid when you need an additional authentication layer in front of the HTTP server.
3.3.6 Auto-Login (Trusted Networks)
For internal or air-gapped deployments where a login form adds no value, replication-manager can issue a JWT token automatically when the browser opens the dashboard.
When api-autologin = true, a public endpoint GET /api/autologin is activated. The dashboard login page calls this endpoint on load and, if it returns a token, skips the login form entirely and redirects to the main view.
Configuration:
# replication-manager.toml
api-autologin      = true
api-autologin-user = "admin"   # optional — admin is the default
Or as command-line flags:
replication-manager monitor --api-autologin --api-autologin-user adminHow it works:
- The browser opens the dashboard and the login page loads
- The login page calls
GET /api/autologin(no credentials required) - The server validates that
api-autologin-userexists inapi-credentials, then mints a JWT token for that user - The token is stored in the browser's
localStorageand the dashboard opens immediately
If api-autologin = false (the default) the endpoint returns 404 and the login form is displayed normally.
Security note: The
/api/autologinendpoint returns a valid admin token to anyone who can reach it. Only enable this on networks where access to port10005is already restricted (private LAN, VPN, firewall rule). Do not enable on a publicly reachable host.
3.3.7 Read-Only Dashboard (/dashboard)
For a public or shared display — a wall screen, NOC board, or a link shared with non-admin users — replication-manager exposes a dedicated /dashboard URL that automatically logs the visitor in as a read-only user.
Unlike api-autologin, the dashboard endpoint is always active as soon as api-dashboard-user is set. No separate enable flag is required. The user must exist in api-credentials and its ACL should be restricted to read-only operations.
Step 1 — Define a read-only user
Add a viewer account to api-credentials and restrict its ACL to show only:
api-credentials         = "admin:repman,dba:repman,viewer:viewerpassword"
api-credentials-acl-allow = "admin:cluster db proxy prov global grant show sale extrole terminal,dba:cluster proxy db,viewer:show cluster-show-backups cluster-show-routes cluster-show-certificates cluster-show-graphs cluster-show-agents"
api-dashboard-user      = "viewer"
Step 2 — Access the dashboard
Navigate to http://<host>:10005/dashboard (or the equivalent HTTPS URL). The login page is skipped — the browser receives a JWT for the viewer account and opens the main dashboard view.
The viewer user can monitor cluster state, browse logs, view backups, routes, certificates, graphs, and agents — but cannot perform any write operations (switchover, failover, configuration changes, provisioning).
Viewer grant breakdown:
| Grant | What it unlocks |
|---|---|
show |
Basic dashboard access (topology, server list, cluster alerts) |
cluster-show-backups |
Backup list and Restic snapshots tab |
cluster-show-routes |
Query rules tab |
cluster-show-certificates |
Certificates tab |
cluster-show-graphs |
Graphite graphs tab |
cluster-show-agents |
Agents tab |
global-admin-show |
Global logs, host metrics, and alerts accordion (see security note below) |
Security warning —
global-admin-show: This grant exposes server-level information including host CPU/memory/disk metrics, replication-manager version, database versions, and proxy versions. An attacker with access to this data gains version fingerprinting that can be used to identify exploitable CVEs. Only assignglobal-admin-showto viewer accounts on trusted internal networks. For public dashboards or untrusted viewers, omit this grant — the cluster-level view (show+cluster-show-*) does not expose host or tool version details.
Minimal viewer (public/untrusted):
api-credentials-acl-allow = "...,viewer:show cluster-show-backups cluster-show-routes cluster-show-certificates cluster-show-graphs cluster-show-agents"Full viewer (internal/trusted):
api-credentials-acl-allow = "...,viewer:show cluster-show-backups cluster-show-routes cluster-show-certificates cluster-show-graphs cluster-show-agents global-admin-show"Configuration reference:
| Parameter | Default | Description |
|---|---|---|
api-dashboard-user |
"" |
Username to use for /dashboard auto-login. Empty = endpoint disabled (returns 404). |
Security note:
GET /api/dashboard-tokenreturns a token to any visitor without credentials. Set thevieweruser's ACL to the minimum required (e.g.showonly). The endpoint is disabled whenapi-dashboard-useris empty — remove or clear the key to turn it off.
3.3.8 Cluster Slideshow (/dashboard → /slideshow)
For the full-screen NOC-style slideshow that cycles through all monitored clusters, see the dedicated Cluster Slideshow page in the Monitoring section.