Metrics Monitoring
replication-manager embeds a graphite database to store metrics about databases and proxies status.
replication-manager 2.1 expose Prometheus metrics for all servers under clusters
graphite-embedded (1.1)
| Item | Value |
|---|---|
| Description | Enable Graphite Server. |
| Type | Boolean |
| Default Value | false |
graphite-metrics (1.1)
| Item | Value |
|---|---|
| Description | Collect and send metrics to a Graphite Server. |
| Type | Boolean |
| Default Value | false |
graphite-carbon-host (1.1)
| Item | Value |
|---|---|
| Description | Host of the Graphite server to send metrics. |
| Type | String |
| Default Value | "127.0.0.1" |
graphite-carbon-port (1.1)
| Item | Value |
|---|---|
| Description | TCP & UDP port of the Graphite server to send metrics. |
| Type | Integer |
| Default Value | 2003 |
graphite-carbon-api-port (1.1)
| Item | Value |
|---|---|
| Description | Graphite Carbon API port. |
| Type | Integer |
| Default Value | 10002 |
graphite-carbon-link-port (1.1)
| Item | Value |
|---|---|
| Description | Graphite Carbon Link port. |
| Type | Integer |
| Default Value | 7002 |
graphite-carbon-pickle-port (1.1)
| Item | Value |
|---|---|
| Description | Graphite Carbon Pickle port. |
| Type | Integer |
| Default Value | 2004 |
graphite-carbon-pprof-port (1.1)
| Item | Value |
|---|---|
| Description | Graphite Carbon pprof port. |
| Type | Integer |
| Default Value | 7007 |
graphite-carbon-server-port (1.1)
| Item | Value |
|---|---|
| Description | Graphite Carbon HTTP port. |
| Type | Integer |
| Default Value | 10003 |
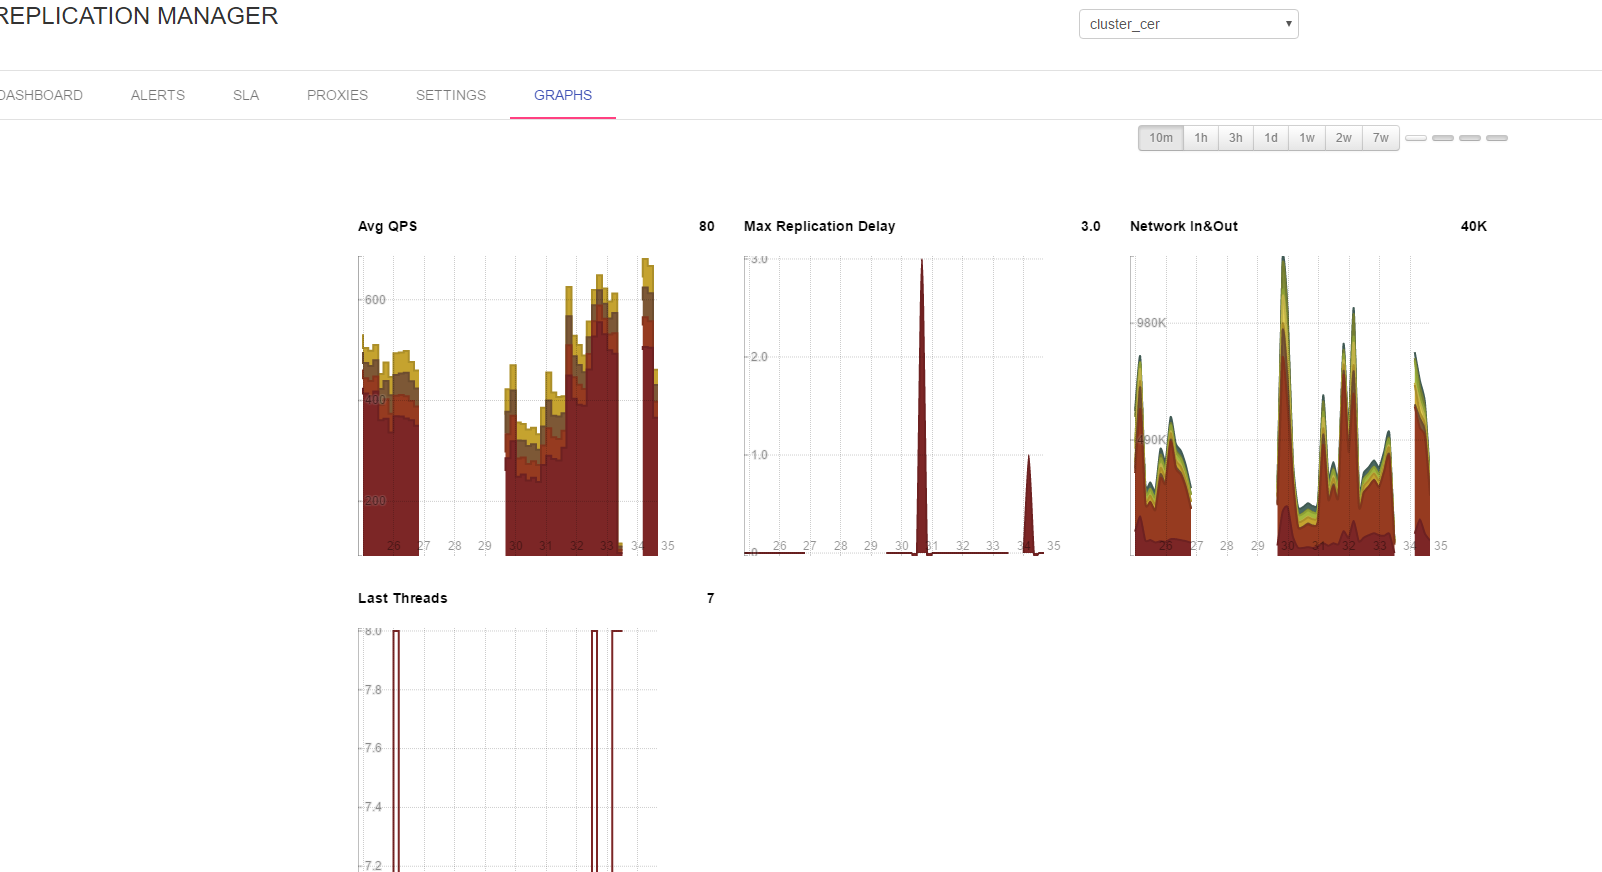
HTTP Graph are display via the giraffe JS library.
Customizing the trends can be done modifying.
/usr/share/replication-manager/dashboard/static/graph.jsSet the replication-manager host or IP address to tell where to found the graphite server
Replication and some databases status metrics are pushed inside carbon, the metrics are pushed with the server-id prefix name. to get unicity against nodes
We can advise usage of Statd and Collectd on each database node and send metrics to replication-manager whisper port to add extra system metrics to the cluster.
One can create custom dashboard via Grafana.
The port to use as direct data source in grafana is drive by graphite-carbon-api-port default 10002.
http://127.0.0.1:10002/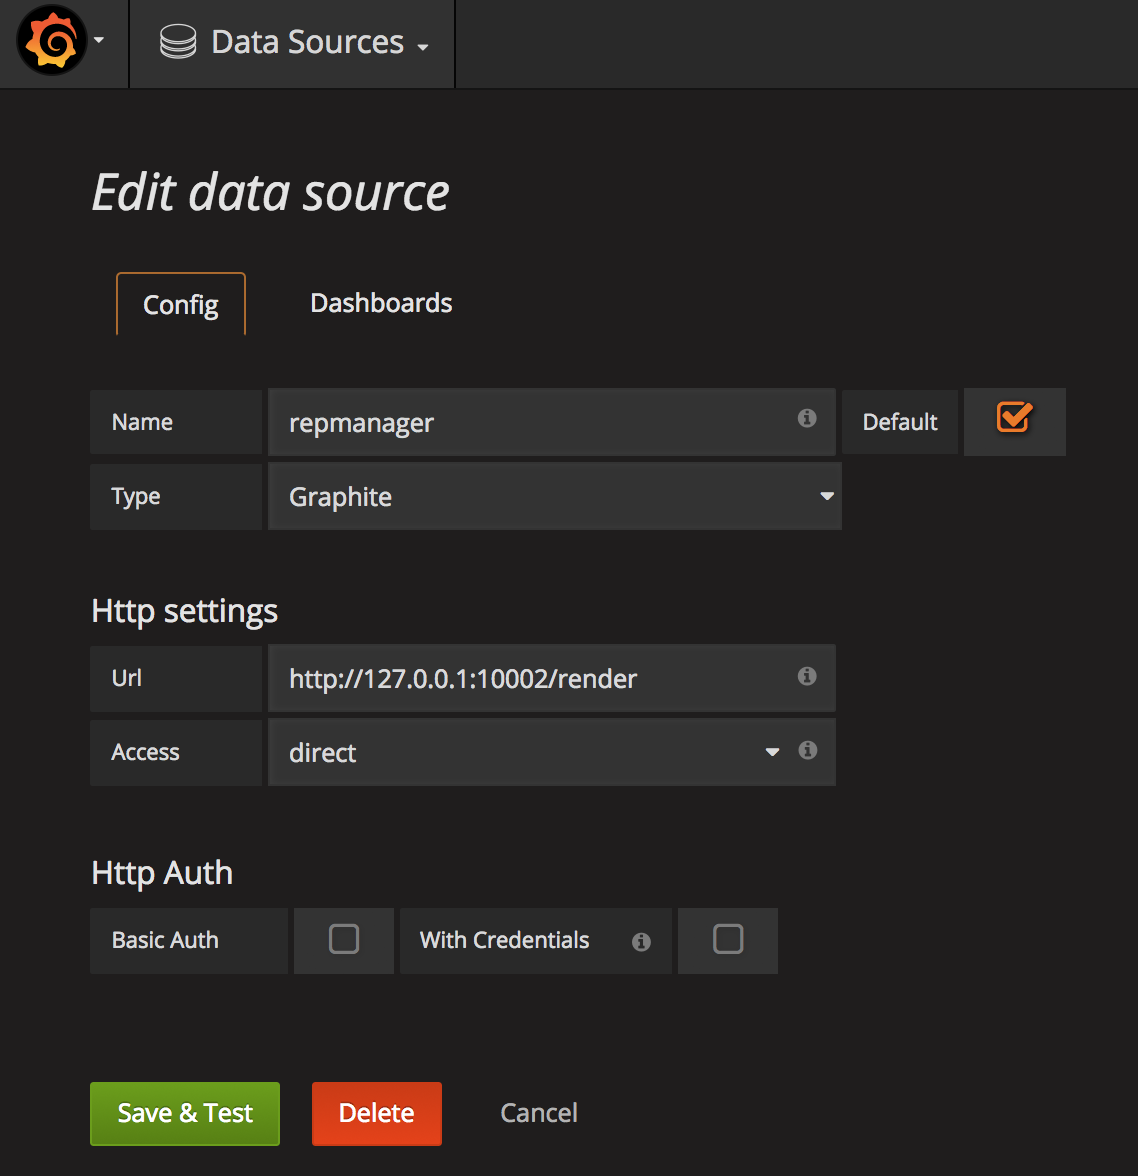
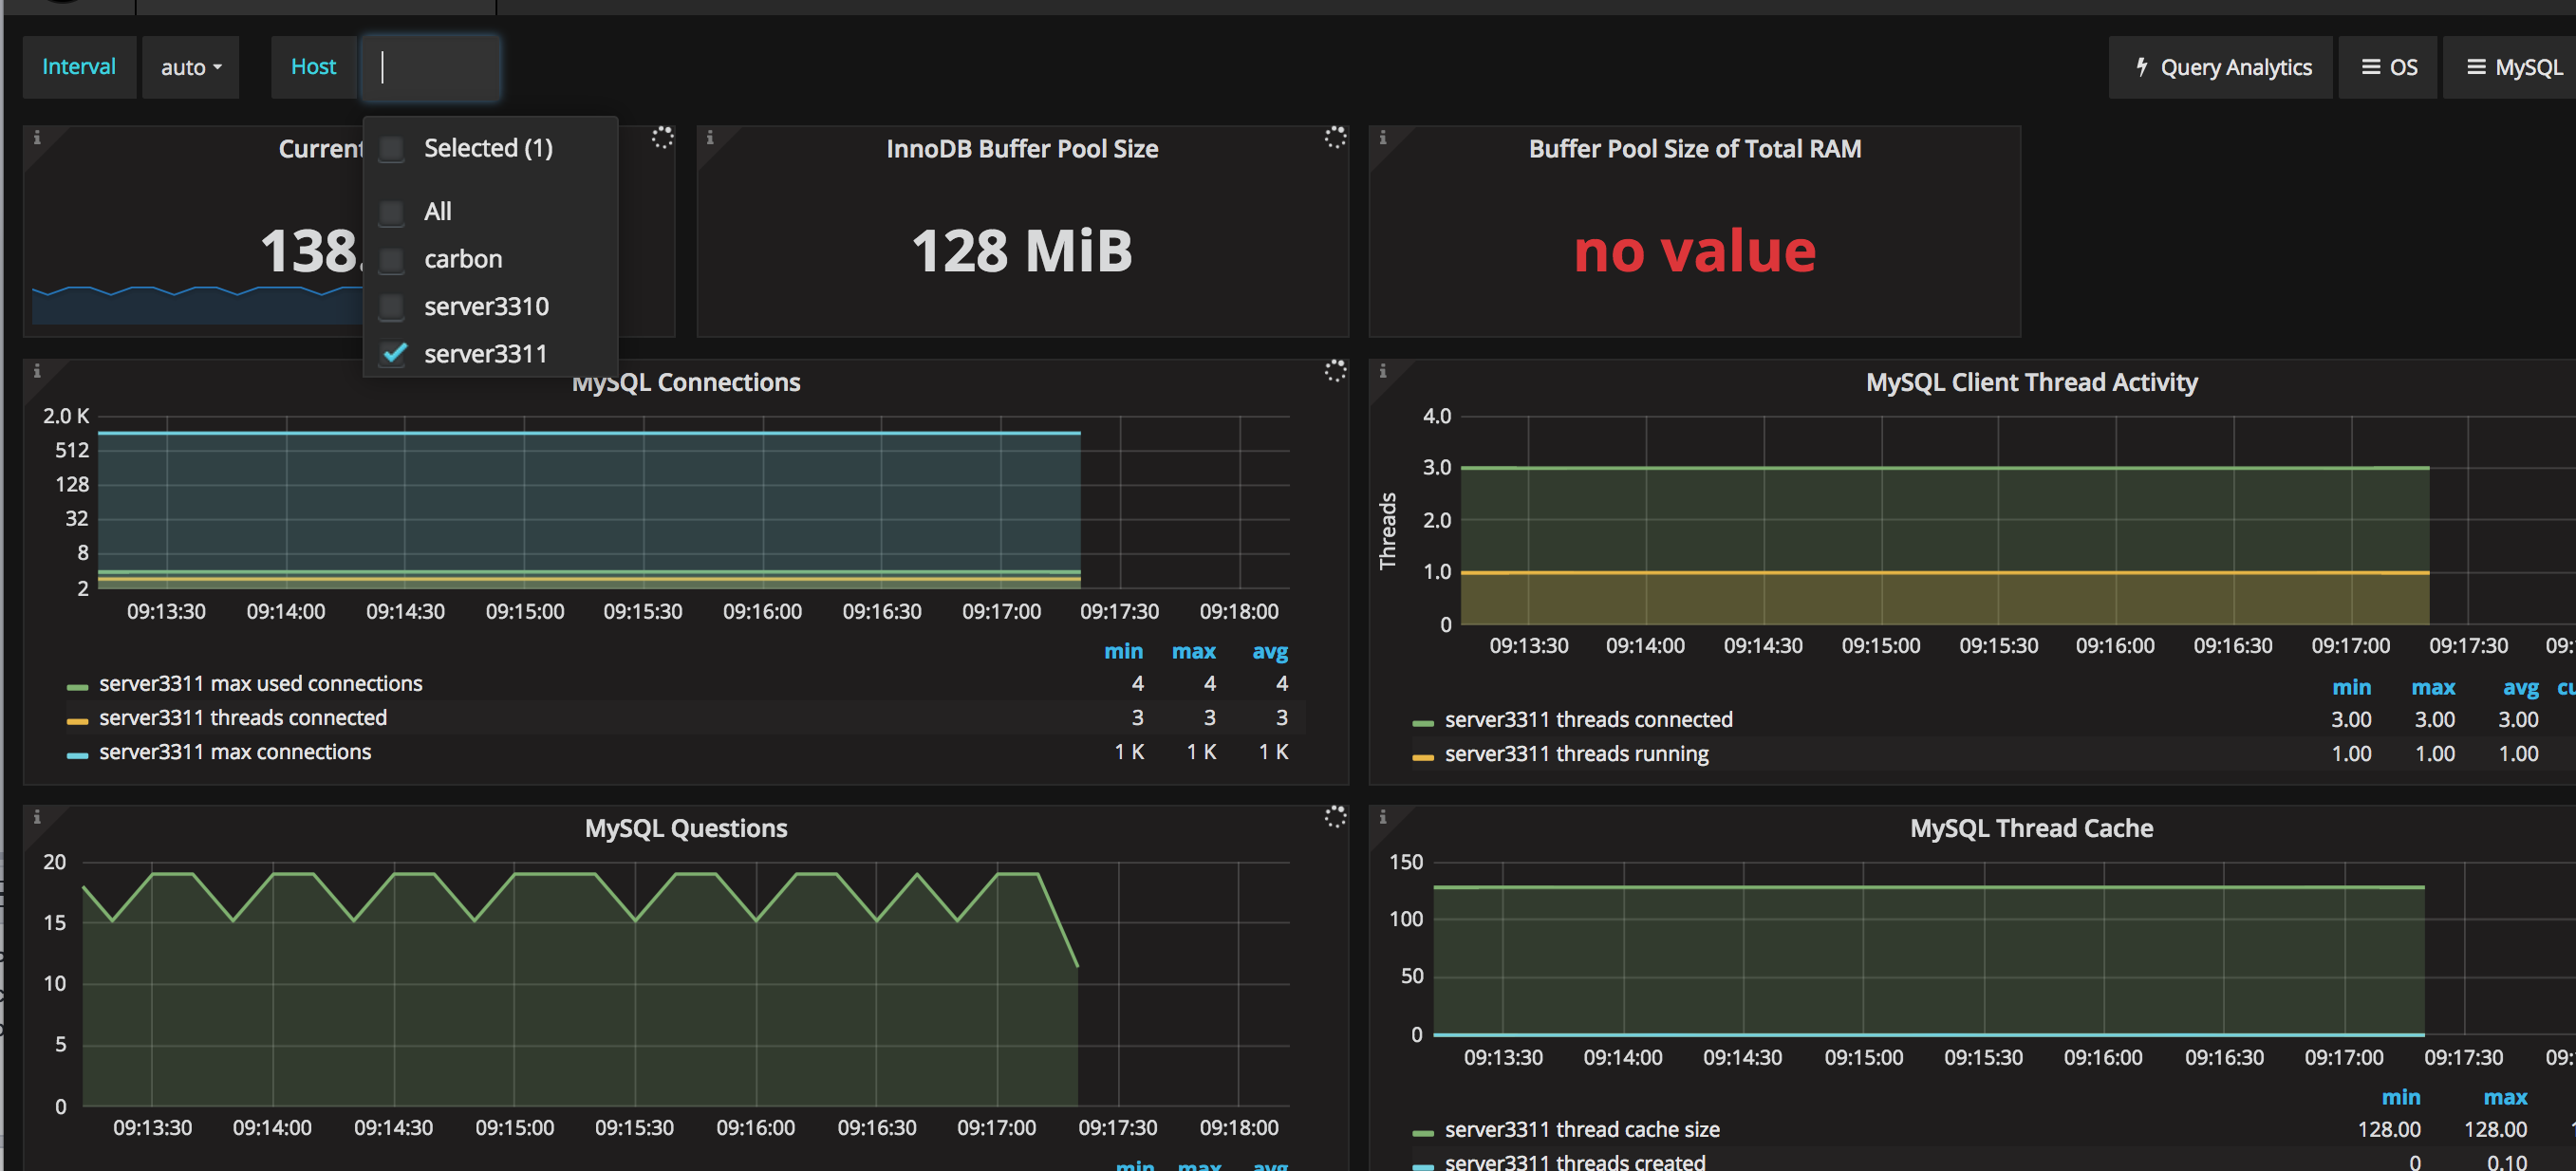
In replication-manager 2.0 more metrics are pushed to graphite using prefix
- [x] Each database global status mysql.host.mysql_globalstatus(metric)
- [x] Each database global variables mysql.host.mysql_globalvariables(metric)
- [x] Each database show slave status mysql.host.mysql_slavestatus(metric)
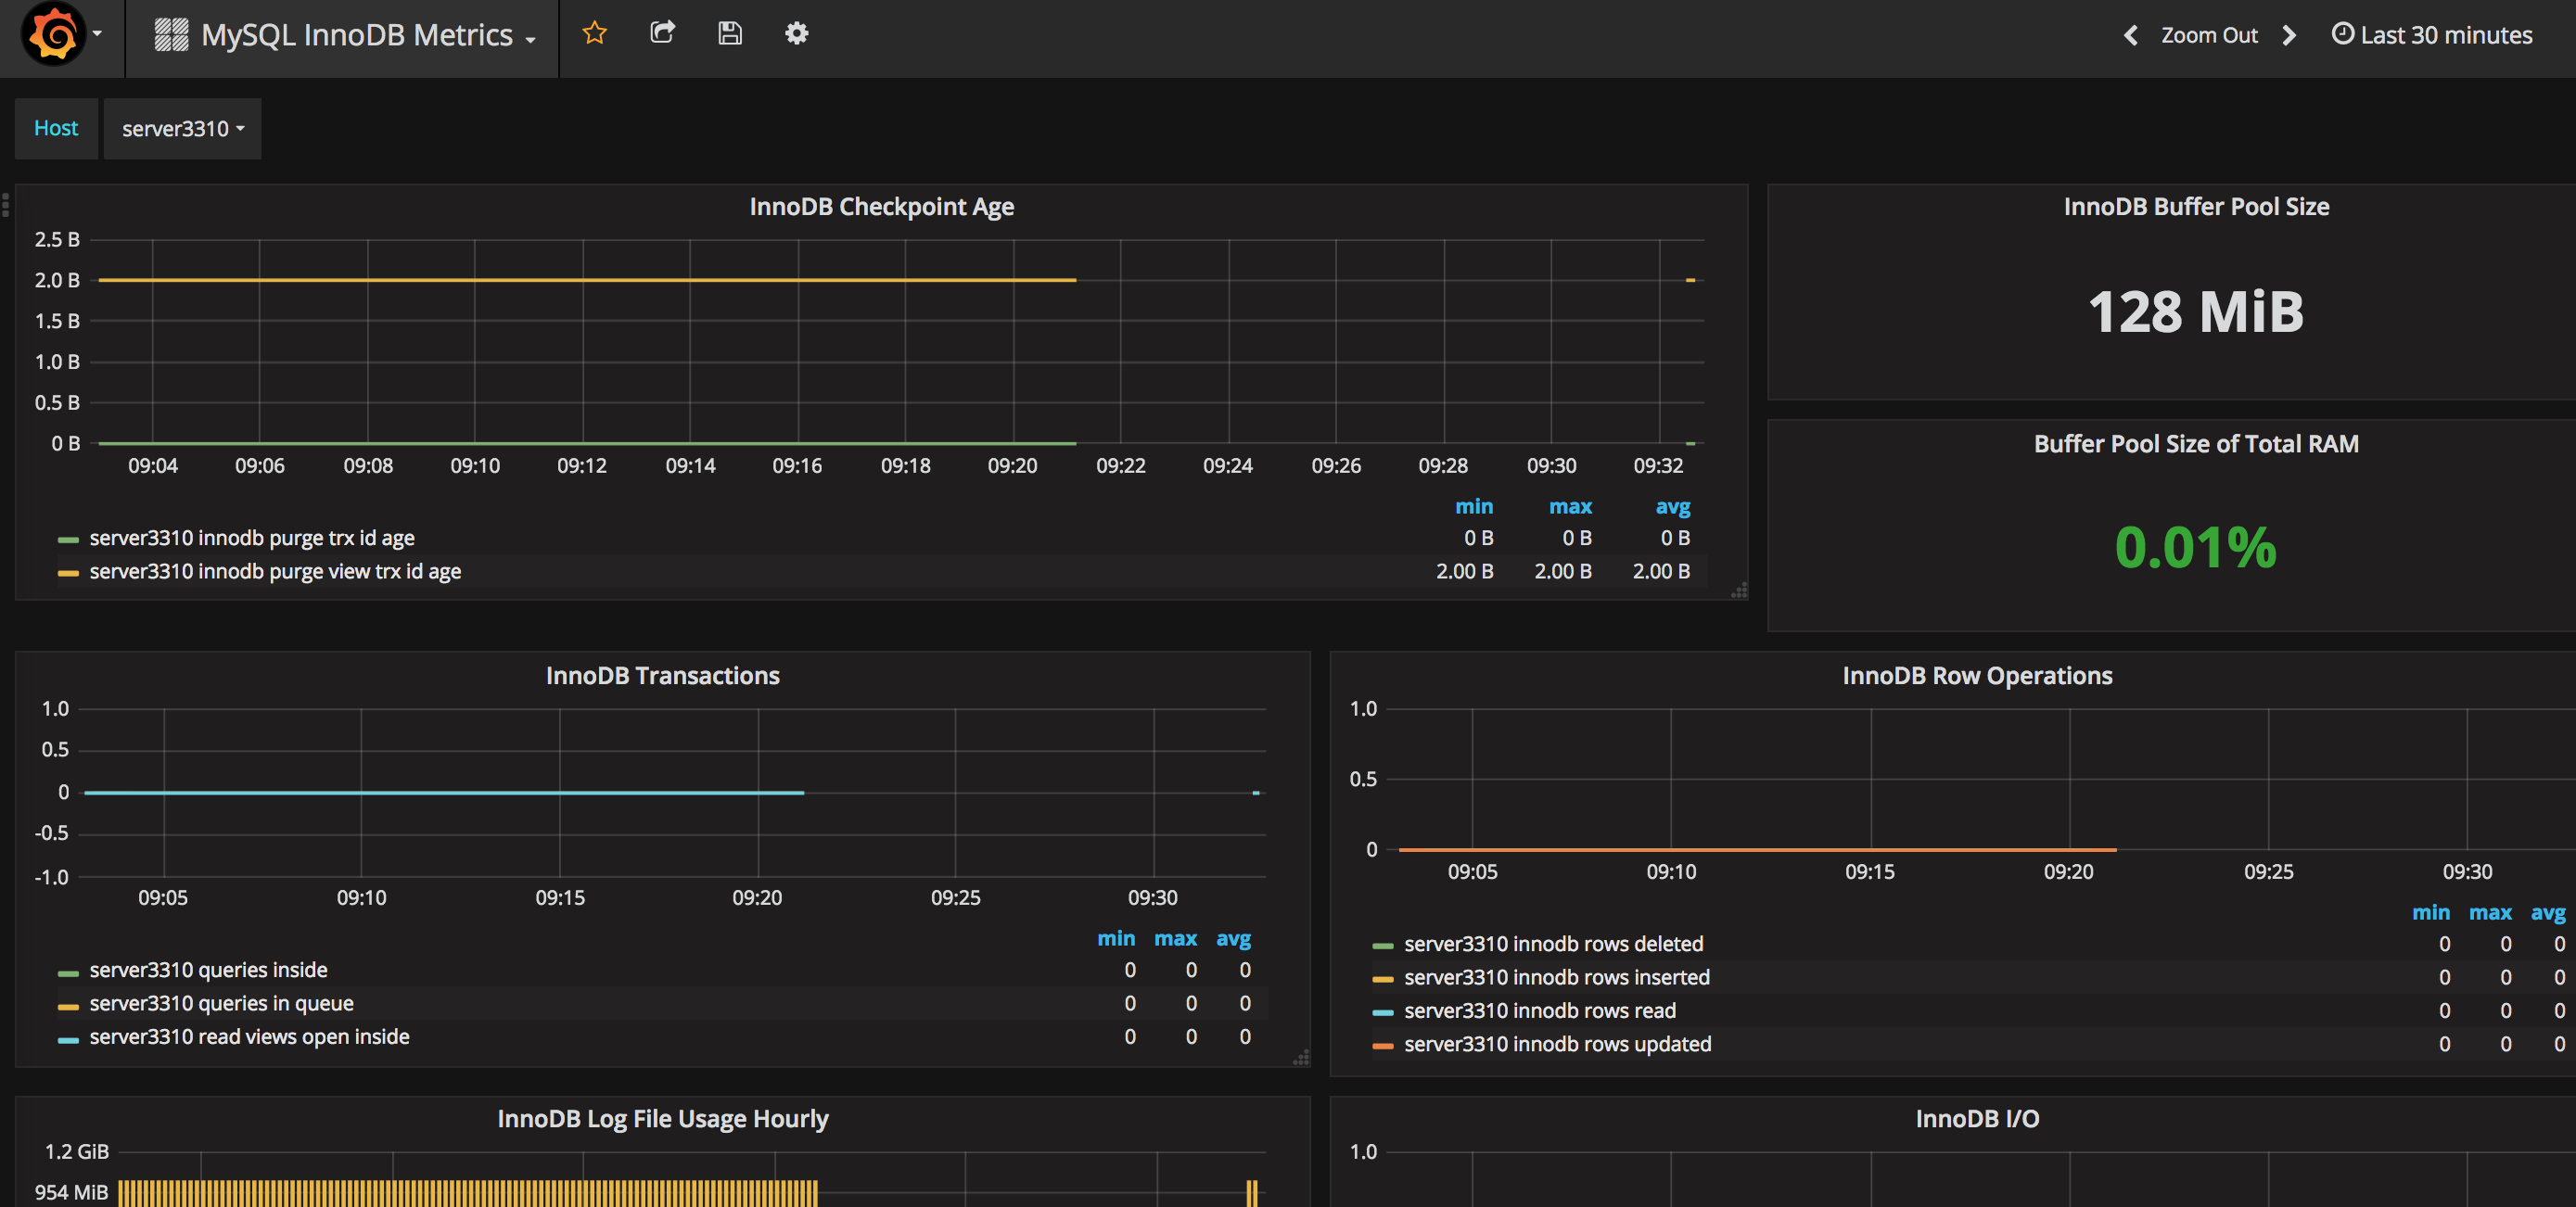
- [x] Each database show engine InnoDB mysql.host.engineinnodb(metric)
- [x] Top 20 database performance schema mysql.host.pfs.digest_(metric)
Some Grafana dashboard using such metric names can be found in the share directory of replication-manager.
Prometheus URI available 2.1
http://demo.signal18.io/api/prometheus